Creating Bar Charts with Baselines Using Customised Shapes in Plotly
A quick demonstration of adding customised shapes to bar charts in Plotly with R.

Deploying R Shiny apps using ShinyProxy on Windows 10
This post provides a guide to use ShinyProxy, an open-source tool with enterprise features, to deploy R Shiny apps.

Dplyr Functions with String
A trick to use string as arguments in dplyr functions

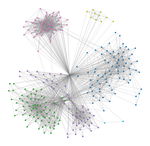
Creating and Analysing Facebook Friend Network Graphs Using Python
A guide to analysing social network with Python
Cache Time-consuming Computations in R
Quick demonstration of caching time-consuming computations in R

Are My Twitter Followers Bots?
A Python script that checks Twitter bots with Botometer API